I experimented with batter stats last year, but that was looking at the horrible and injury-and-demotion skewing Twins. This year, I decided to look at the development of the American League triple-crown stats' leaders, as, at the end of the year, one Tiger was atop all three lists.
For parts 1-3, here are Monday's look at the AL, and Tuesday's look at the NL, and yesterday's look at the Wild Card and Draft Position races.
American League Batting Average:
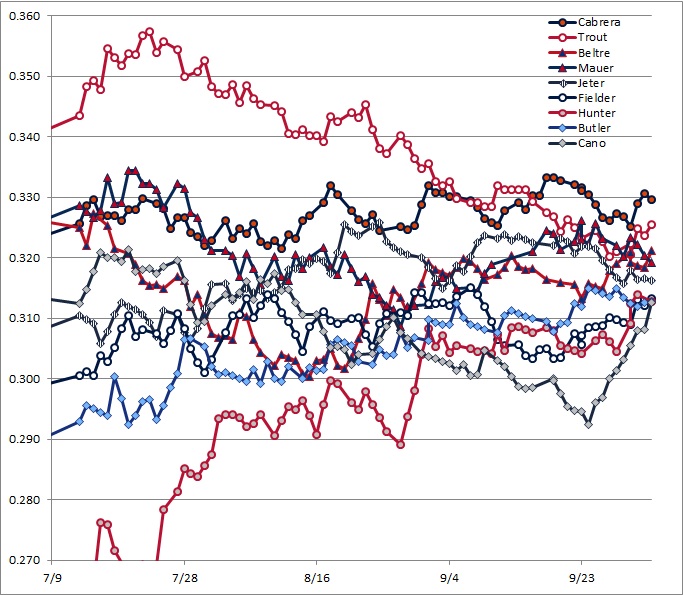
Showing the top nine finishers, all that finished over .310. The first point on the graph represents the first day's play. I didn't start players at zero.
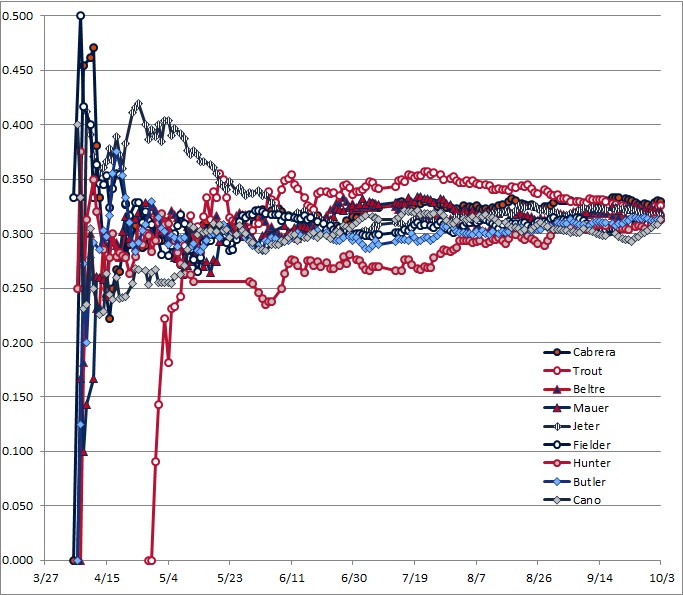
Well, that doesn't look all that usable. Let's zoom in starting after the All-Star break:
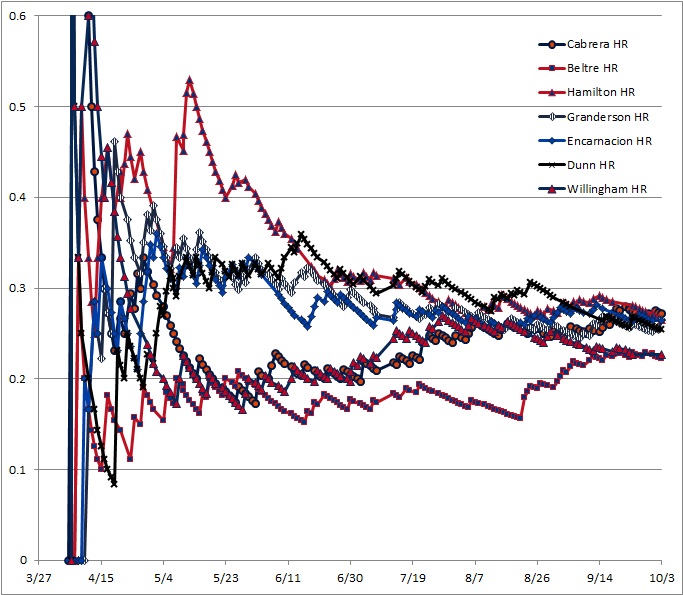
American League Home Runs:
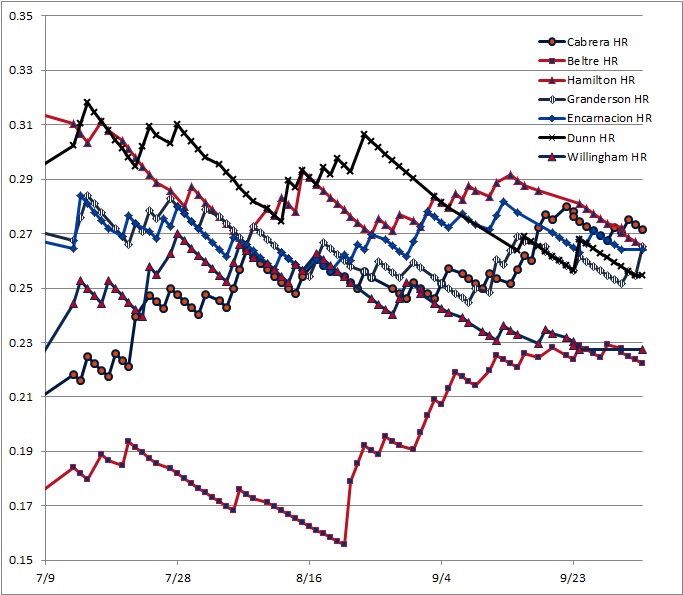
Showing the top seven finishers, all that finished at or above 35. I didn't like the graph that showed the race like climbing a ladder, so I changed this and divided the number of homeruns at each point by the number of games that the player's team had played. As all teams played 162 games, the end-of-the year result is the same. I'm showing HR/Gtm. If the player hit a homerun on the first day he played for the year, he has two points that day: one at zero and one at the rate. For players that did not play on the last day of the year (like Willingham), I added a point there to have all lines extend to the end, and to have all of the rates final. (This didn't come up on the Average graphs because all nine of those players played in the final game of the regular season.)
Again, zooming in after the All-Star break:
American League Runs Batted In:
Showing the top ten finishers, all that finished at or above 96. (I would have only done the top nine: each with more than 100, but I already had Dunn's data from the HR race, so I kept him in.) Like with the HR graph, I switched to RBI/Gtm. Also like with the HRs, I started all players at zero on the first day each played for the year, and I extended all players who didn't play on the last day with a final point.
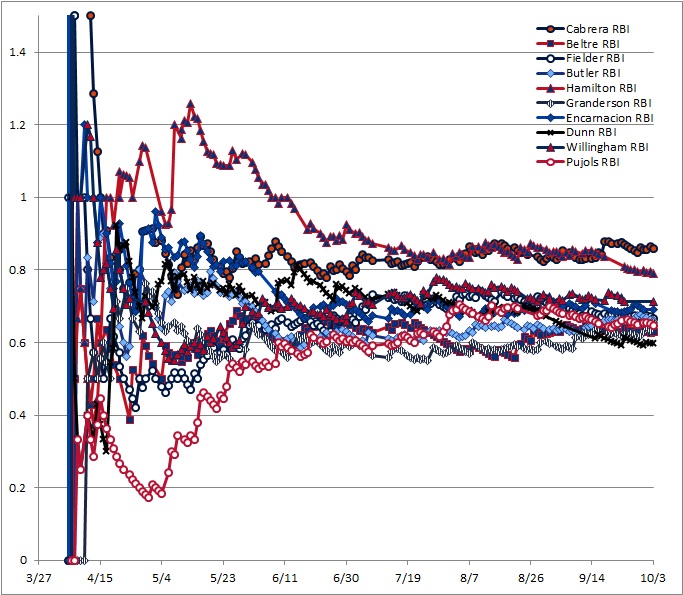
One more time, zooming in after the All-Star break:
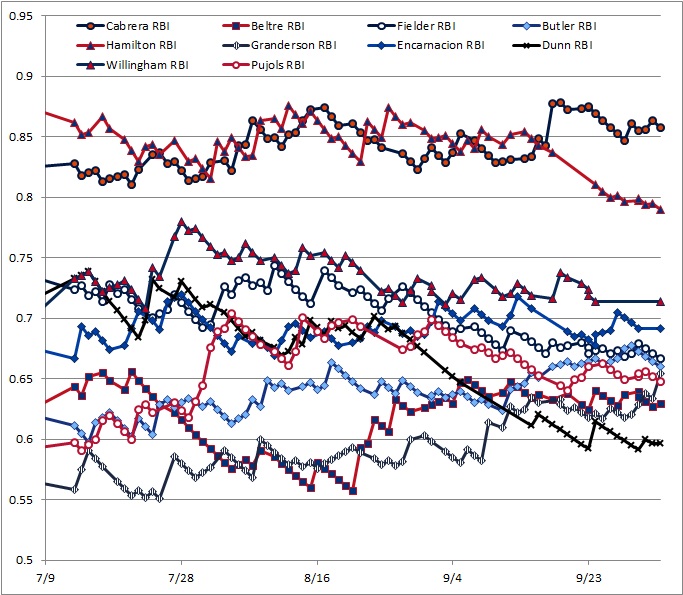
I hope you've enjoyed these graphs. I think that if anyone wanted to vote for Beltre for MVP, graphs like these could sure help.
Colors (mostly) match official team colors as they are in Wikipedia.
I guessed at the (road) grey I used for Hunter and Cano.
I just realized that I used Ranger-colored triangles for Beltre in the BA graphs, but in the HR and RBI graphs, Ranger-colored triangles are Hamilton, and Beltre is a square. Helf-Baked!