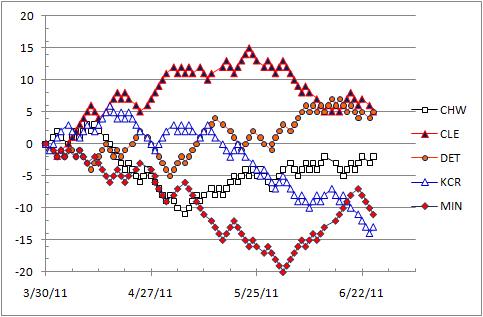
I was putting some things off during the Twins game yesterday and the game wasn't enticing any more, I played with Excel and baseball-reference's CSV data table option. As I did this all during the game, it does not reflect the results of the games of that day. So, although it looks like the Twins are a game out of last place, they are now in last place, again (by percentage points behind the Royals).
I like to "look" at data, so this is my looking at it. I think of this stuff like I'm taking the progression of the season -- distilled into statistics -- and converting it into a graph that then informs my narrative.
———————————————
The style of the first table may be memorable from the WGOM 1.X: games above (below) .500 in the division, showing the development of the race over the season. The ordering of the teams, however, is not familiar.

Continue reading AMR’s Graphs: 6/25/2011


