Tag Archives: Graphs

AMR Graphs: The 2012 AL Triple Crown (Part 4 of 4)

I experimented with batter stats last year, but that was looking at the horrible and injury-and-demotion skewing Twins. This year, I decided to look at the development of the American League triple-crown stats' leaders, as, at the end of the year, one Tiger was atop all three lists.

For parts 1-3, here are Monday's look at the AL, and Tuesday's look at the NL, and yesterday's look at the Wild Card and Draft Position races.

American League Batting Average:
Showing the top nine finishers, all that finished over .310. The first point on the graph represents the first day's play. I didn't start players at zero.
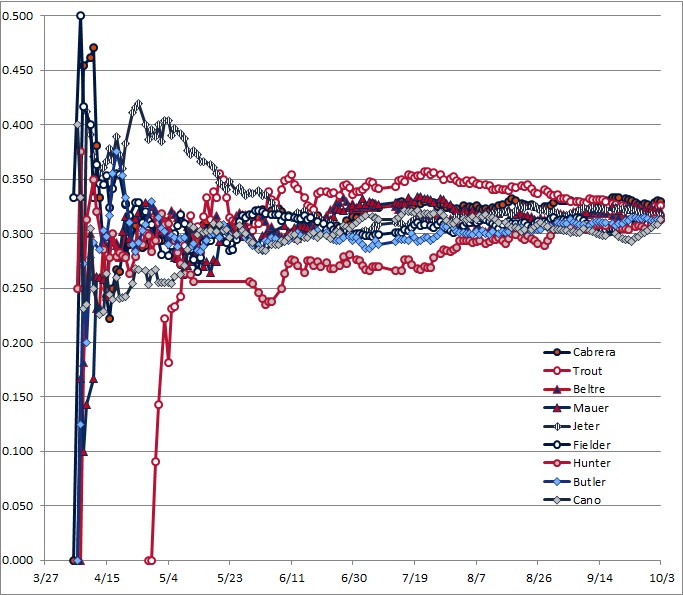
Well, that doesn't look all that usable. Let's zoom in starting after the All-Star break: Continue reading AMR Graphs: The 2012 AL Triple Crown (Part 4 of 4)

AMR Graphs: The Wild Cards and Draft Pick Races (Part 3 of 4)

Today, a look at how the inter-division Wild-Card races developed, and also the Race for draft position. Here's Monday's look at the AL, and yesterday's look at the NL.

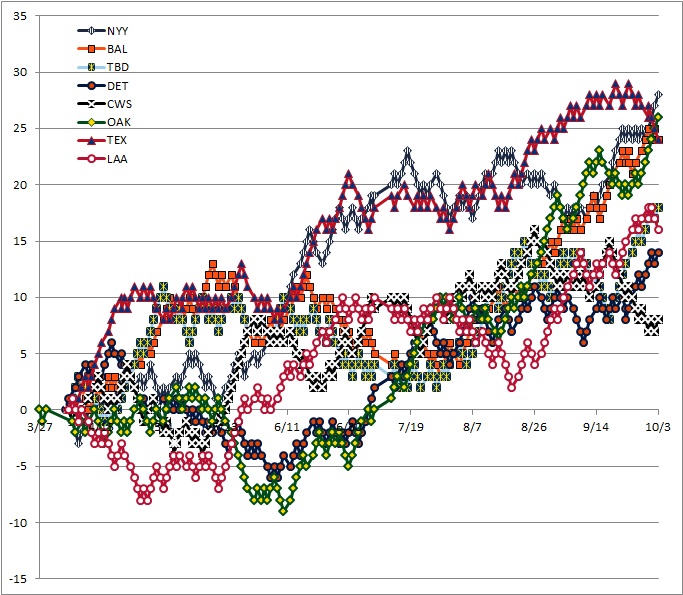
These graphs show games above or below .500 at the conclusion of each game. So double-headers will show two markers, one above the other. I started each team off at 0 on the day preceding its first game.

American League Wild Card Race:
There was a lot of churning going on in these races up until the very end, with Basically six teams contending for four playoff spots. I also kept the Sox in there (and the Tigers) to show that as late as August 29, not only did the Sox have a lead in the Central division, but they also had the third-best record in the American League as a whole. From that point, they went 13-20 and finished with the eighth-best record in the AL

Continue reading AMR Graphs: The Wild Cards and Draft Pick Races (Part 3 of 4)

AMR Graphs: The 2012 American League (Part 1 of 4)

I've done these in the past and here they are for 2012. Nothing really cool stands out this time around.

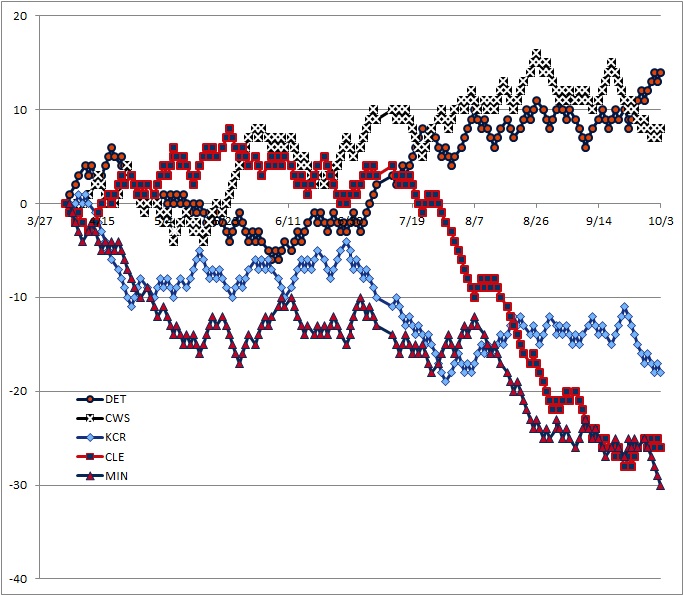
These graphs show games above or below .500 at the conclusion of each game. So double-headers will show two markers, one above the other. I started each team off at 0 on the day preceding its first game.

American League Central

Continue reading AMR Graphs: The 2012 American League (Part 1 of 4)

AMR’s Graphs: 6/29/2011

I don't think I'll make a regular series out of these, but I wanted to see how hard it would be to show games behind second place. Might as well share.

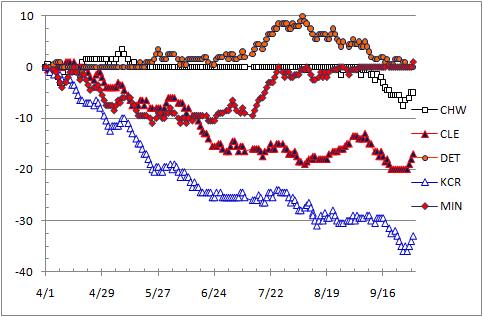
It appeared for most of 2006 that the Tigers and ChiSox were both going to the playoffs, the race was just for HFA. No teams from the other two divisions made a decent run at the Wild Card, so I'm basically thinking as second place in the ALC as a proxy for the WC-leading team.

The chart of games above second place shows that once the Twins started making their run, the Tigers held them off for a long time, but the ChiSox did not.
AL Central 2006: Games Behind Second Place
Continue reading AMR’s Graphs: 6/29/2011

AMR’s Graphs: 6/25/2011

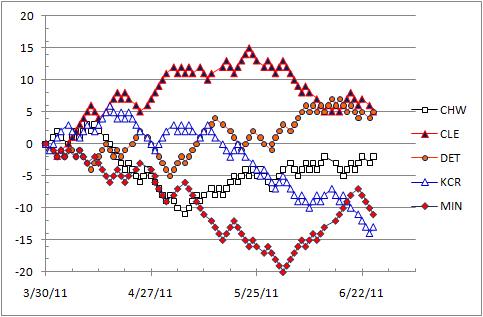
I was putting some things off during the Twins game yesterday and the game wasn't enticing any more, I played with Excel and baseball-reference's CSV data table option. As I did this all during the game, it does not reflect the results of the games of that day. So, although it looks like the Twins are a game out of last place, they are now in last place, again (by percentage points behind the Royals).

I like to "look" at data, so this is my looking at it. I think of this stuff like I'm taking the progression of the season -- distilled into statistics -- and converting it into a graph that then informs my narrative.

———————————————

The style of the first table may be memorable from the WGOM 1.X: games above (below) .500 in the division, showing the development of the race over the season. The ordering of the teams, however, is not familiar.
AL Central 2011: Games Above .500 through 6-25
Continue reading AMR’s Graphs: 6/25/2011