Are the Wild good?
This is the question that keeps getting asked. It's kind of hard to believe that the Wild might be anything other than a middle of the road team that people mention only to say "yeah, they're ... OK, I guess." But here we are. They took 4 points off Vegas, and continue to dominate teams during 5 on 5 play and get pretty good goaltending to go along with it. At some point, the question has to be taken seriously.
The Analytic Method
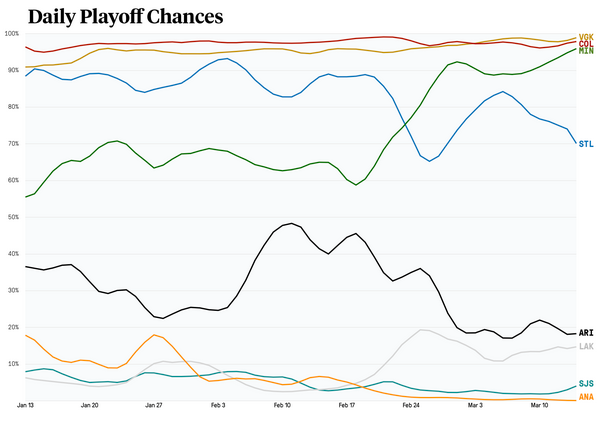
Dom Luszczyszyn at the Athletic has a model that bases predicted outcomes on his Game Score stat (calculated by counting stats like goals, assists, shots, penalties drawn, but also factoring in possession stats like xG, faceoffs, and CORSI) as well as factors like strength of remaining schedule, injuries, etc. I like it because he continually updates how things have changed over the season, so you can see exactly where the model started to buy into the Wild as a legitimate contender in the West division along with Colorado and Las Vegas.
Evolving Hockey uses a team goal differential stat to compare team performance. The stat is broken down into four components:
- Shot Rates
- Shot Quality
- Shooting
- Goaltending.
In comparing the teams in the West across these four factors we see once again that the Wild are comfortably in the same statistical neighborhood as Vegas and Colorado.
The numbers in the table represent the team's rank out of 31 NHL teams. Shot Rate and Shot Quality are a comparison between a team and their opponent. The Wild have the largest differential in the NHL between the average quality of their offensive shots and the quality of shots they allow (they rank 5th in shot quality and their opponents rank 29th).
| Team | Goal Differential | Shot Rate | Shot Quality | Shooting% | Save% |
|---|
| Las Vegas | 2 | 3 | 22 | 9 | 1 |
| Minnesota | 5 | 9 | 1 | 17 | 12 |
| Colorado | 6 | 1 | 18 | 19 | 16 |
| Los Angeles | 17 | 26 | 17 | 15 | 6 |
| St. Louis | 19 | 19 | 20 | 3 | 24 |
| Arizona | 23 | 31 | 16 | 23 | 7 |
| San Jose | 25 | 22 | 13 | 18 | 29 |
| Anaheim | 28 | 23 | 25 | 31 | 23 |
The DG plays with Spreadsheets Method
Which teams in the division have winning records (taking more than 50% of the points) against other teams in the division? Point percentage in this case is percentage of the points awarded in a game. So a win in regulation gets a team 100%, a win in OT or shootout gets them 67%, OT/SO loss gets them 33% and regulation loss 0%. Don’t be mad at me that this makes no sense, take it up with the NHL Standings Point Policy director.
TIER 1 - Las Vegas, Colorado, and Minnesota each have a points% greater than or equal to 50 against all but one team in the division. Las Vegas is lower than 50% against Minnesota, Minnesota is lower than 50% against Colorado, and Colorado is lower than 50% against ... you guessed it - Anaheim. (Colorado and Las Vegas have split their two games, so are each at 50% in their matchup).
TIER 2 - St. Louis, Arizona, and Los Angeles are each above a 50% points percentage against 3 other teams in the division. This seems like a natural second tier in the division so far this season. Dom's model would see this as a slight to St. Louis, but I think this matches the actual results pretty well.
TIER 3 - San Jose and Anaheim are certainly the low end of the West, generally not beating anyone consistently.
Now I can compare each teams result against those tiers so far this season:
| Team | P% vs. Tier 1 | P% vs. Tier 2 | P% vs. Tier 3 |
|---|
| Las Vegas | 47% | 75% | 74% |
| Minnesota | 50% | 64% | 71% |
| Colorado | 53% | 67% | 58% |
| St. Louis | 42% | 40% | 70% |
| Los Angeles | 31% | 62% | 50% |
| Arizona | 28% | 52% | 64% |
| San Jose | 24% | 44% | 75% |
| Anaheim | 39% | 29% | 25% |
| AVERAGE | 38% | 53% | 62% |
What stands out here?
- The Wild and Las Vegas are above average against every tier.
- They've been good and they've been good against everyone in the division.
- Los Angeles and St. Louis against Tier 2.
- The Kings power play caught fire and they steamrolled the Blues over a set of games (Kings went 4-1-1), which makes a big difference in a short season like we've got this year.
- Colorado against Tier 3.
- They've gone to overtime against the Ducks in three of their 4 meetings. That makes it hard to drive up their points% against the bottom of the division.
To quantify how much of each teams standings position came from games against each tier I calculated points earned above average using the numbers above.
| Team | versus T1 | versus T2 | versus T3 | Pts Above Average |
|---|
| VGK | 1.7 | 4.4 | 2.2 | 8.3 |
| MIN | 2.2 | 2.8 | 1.0 | 5.9 |
| COL | 2.7 | 2.8 | -0.8 | 4.7 |
| L.A | -2.0 | 1.9 | -1.4 | -1.5 |
| STL | 0.4 | -3.9 | 1.6 | -1.9 |
| ARI | -2.2 | -0.2 | 0.3 | -2.1 |
| S.J | -2.8 | -2.2 | 1.6 | -3.4 |
| ANA | 0.0 | -5.7 | -4.4 | -10.1 |
The Grand Conclusion
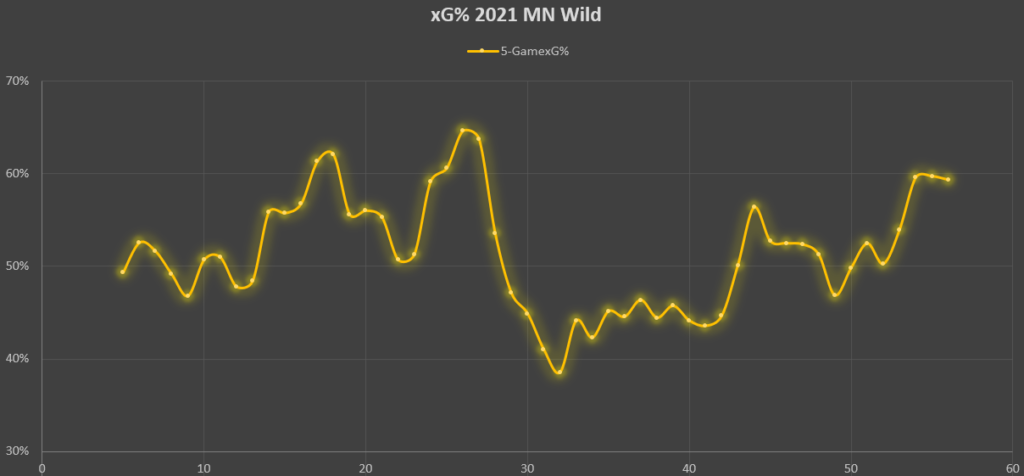
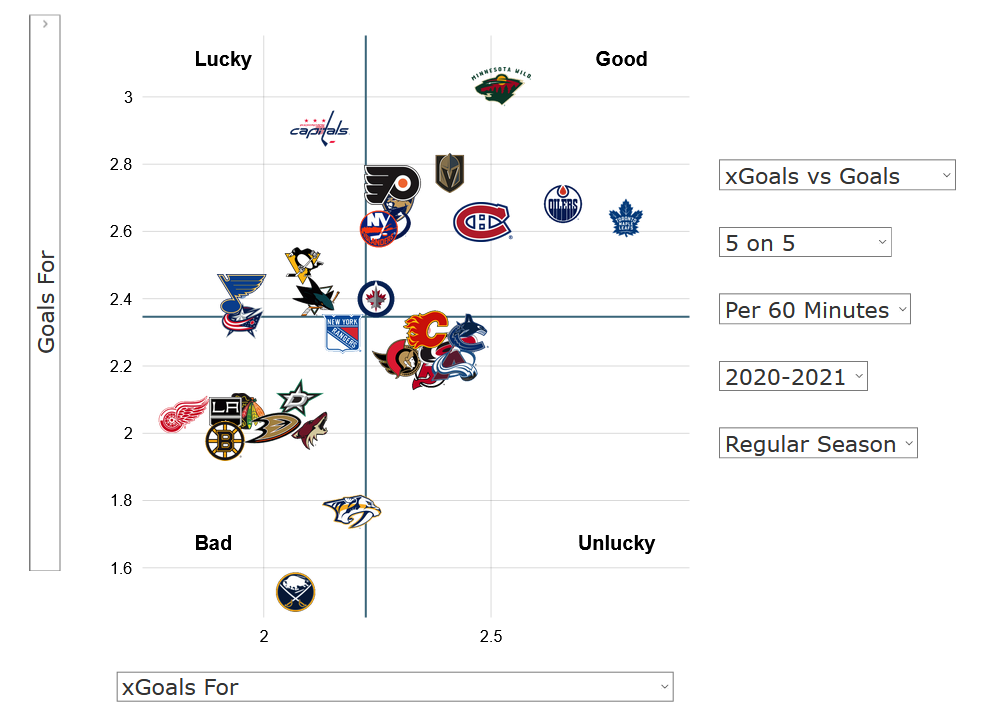
I think they're a good team, actually. Their point total isn't inflated by beating up on the bottom feeders and they've won some games against the best teams in the division. They have the statistical proof that they have played well, but that their success is not a fluke. Their scoring and expected scoring line up pretty well. (figure from MoneyPuck).
There is of course, a warning in this analysis. And that warning is the St. Louis Blues. The Blues have had a remarkably easy schedule in the first half of the season, playing 10 games against SJ and Anaheim (more than anyone in the division) and 5 games against Vegas, Colorado, and Minnesota (fewer than anyone in the division). But they ran up against a hot team in Los Angeles in February and dropped a bunch of points in games that they probably expected to win. Now they have to make those points back in the second half of the season against teams at the top of the division, a much harder task. Those 8 games against the Wild have become a much more important set now that the Blues are looking up at the Wild in the standings.
The first half of the season has gone very well, the Wild have surprised a bunch of people by being legitimately good and exciting and fun. In the second half, the biggest danger becomes running into a cold streak or an opponent's hot streak that cuts into the advantage they've built by playing as one of the best teams in the division so far.
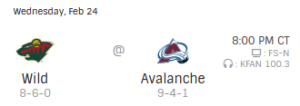
This week's schedule:
A whole bunch more words on the standings are up above, but here's how they look as everyone approaches the halfway point.
- Vegas - 37 points (25G)
- Minnesota - 35 points (26G)
- Colorado - 34 points (26G)
- St. Louis - 33 points (28G)
- LosAngeles - 28 points (27G)
- Arizona - 28 points (28G)
- San Jose - 25 points (25G)
- Anaheim - 22 points (29G)
===================================================
The Kirill Kaprizov Corner
Hat trick! 3 goals in one period! Look at how he shoots this puck on his second goal. He's turning on one skate, with no momentum toward the goal and still scores. AH! It's so good.
And while you're looking at that remember the 10 seconds before that where he comes off the bench like he's been shot out of a cannon and just ... skates past everyone.
He's so much fun.
On the rookie leaderboards, he's first in goals (10), first in assists (14), and first in points (24).
Players not Named Kirill
Who's got the best two-way line in hockey? Your Minnesota Wild, that's who.

Barkov or Barzal will probably win the Selke trophy for best defensive forward, but there will be a whole bunch of stat nerds who will take to Twitter and write "well, actually..." posts in favor of Joel Eriksson Ek.
https://twitter.com/nosalaryretaind/status/1370011339884744704?s=19
The bad news is that Foligno will be out for at least a couple of weeks.
Leaderboards
| Player | G | Player | A | Player | Pts |
|---|
| Eriksson Ek | 11 | Kaprizov | 14 | Kaprizov | 24 |
| Kaprizov | 10 | Greenway | 14 | Greenway | 19 |
| Fiala | 9 | Zuccarello | 14 | Zuccarello | 18 |
| Foligno | 7 | Foligno | 9 | Foligno | 16 |
| Rask | 6 | Brodin/Parise | 9 | Eriksson Ek | 16 |

