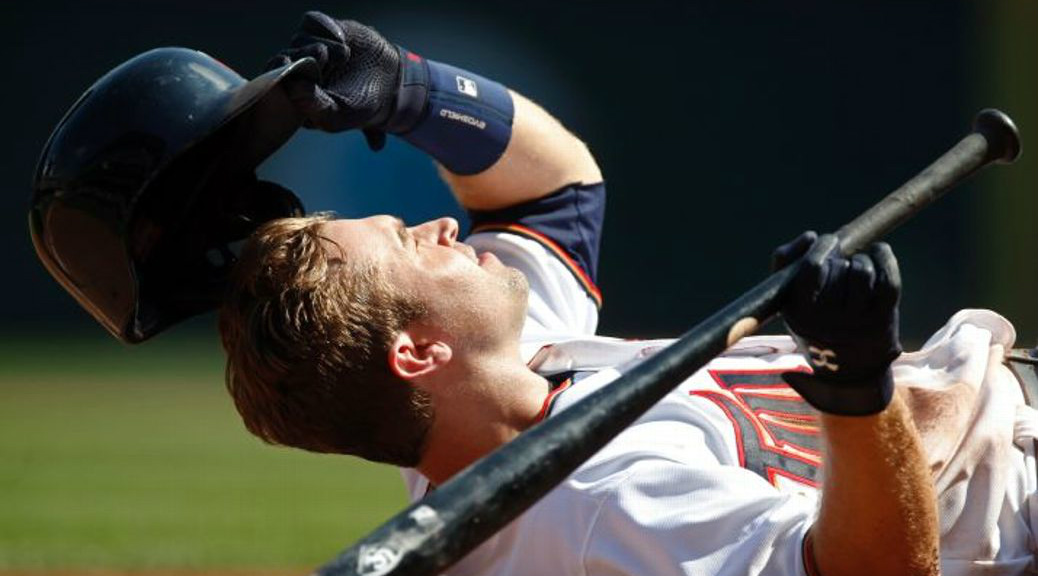
As discussed in yesterday's game log, Dozier has a good chance at making MLB history. He has a great chance at joining Killebrew in the 40 home run plateau. It's a positive so I added a count-up to the sidebar so there would be something to celebrate about this season.
Category Archives: MLB
Walk Don’t Run
The item I shared yesterday about Bryce Harper’s Mother’s Day batting line had me wondering whether any team with a batter posting six walks had lost the game. I’m not spoiling a surprise by saying Harper’s achievement was unprecedented on the losing side of a box score.
I thought it would be interesting to see if there were any functional equivalents to Harper's 6 BB, HBP line – something to the effect of 7 BB, or 5 BB 2 HBP, or 4 BB, 3 HBP – and if so, how many. Here’s what I found via Play Index:
No player has ever “batted” a 7 BB line in the Play Index Era (1913-present). No player has “batted” a 5 BB, 2 HBP line. Likewise, no player has ever “batted” a 4 BB, 3 HBP line. (In fact, no player has ever had even a 4 BB, 2 HBP game.) So, this is a fairly historic achievement.
There have only been four games since 1913 in which a player has walked six times. For the sake of interest, let’s throw in any player who has “batted” a functionally equivalent 5 BB, HBP line. Why not include hits in my definition of “functionally equivalent”? See the title of this post.
Anyway, that brings us to six total games, and six unique players:
| Dude | Date | BB+HBP |
|---|---|---|
| Player V | 13-09-1974 | 5 BB+HBP |
| Player W | 30-06-2000 | 5 BB+HBP |
| Player X | 16-06-1938 | 6 BB |
| Player Y | 02-05-1984 | 6 BB |
| Player Z | 20-08-1999 | 6 BB |
| Harper | 08-05-2016 | 6 BB+HBP |
Here’s where it gets interesting.
Harper “batted” his line in a 13 inning game, appearing at the plate in the first, third, fourth, sixth, eighth, tenth, and twelfth innings. Of Harper’s six free passes, three were intentional.
Let’s work backward from 2016 and look at the others. Our first jump takes us back sixteen seasons.
Player W was the most recent player to walk five times (one intentional) and get plunked for an additional visit to first base. His OPB climbed from .387 to .396, but his OBP slid back down the mountain by over twenty points by season's end. Here’s his line from that fifteen inning game:
8 PA, H, 2 RBI, 5 BB, HBP
Jump back one more season. Player Z was the most recent player to walk six times, which included two intentional passes. His OBP jumped from .447 to .451 at the end of the day, on its way to a humid .454 at the end of the season. Here’s his line from that sixteen inning game:
8 PA, R, 6 BB, SB
Fifteen seasons earlier, Player Y “batted” the second-ever six walk game. It was early in the season, but a nearly 40-point jump in OBP is still impressive. Six walks certainly put some growl in his stat line. Apparently the pitchers he faced could hear it; two of his walks were intentional. Here’s his line from that sixteen inning game:
8 PA, R, 6 BB
Jump back another ten seasons. Player V’s day was something else; I challenge you to find anything quite like it. He earned five walks, including two intentional, heloping raise his OBP from .386 to .393 in one September game. (He finished the season just downriver of that high water mark, at .389.) Here’s his complete line from that seventeen inning game:
9 PA, H, RBI, 5 BB, HBP, GDP
Roll back forty-six more seasons. Finally, we get to Player X and the day he embarked on a sextet of gratuitous constitutionals, the first in recorded baseball history. When I was looking for functionally equivalent lines to 6 BB, one of the search metrics I used on Play Index was BB >= 6, PA >= 7. I was just curious to see what might come up. Turns out, what was more interesting was what didn’t come up. One player of the Six Walk Quartet was missing.
Player X, who walked in every plate appearance he made that day. Here’s his line:
6 PA, 2 R, 6 BB
Compared to what we’ve seen above, that might seem almost boring – at least as boring as getting on base six times in six chances could be. Sure, it was the first six walk game. If something can be done, somebody always has to be the first to do it.
Aesthetic aside: What’s more suspenseful to watch – a player going for his sixth walk of the game, or his sixth hit? There have been exactly one hundred six-hit games since 1913, but only four six walk games. One is certainly more rare. But which plate appearance is more exciting to watch? Is your answer the same as it would be for watching Ted Williams go for his 85th consecutive game reaching base vs. Joe DiMaggio go for his 57th consecutive game with a hit?
Here’s where it gets really interesting.
Look back at the lines above. I didn’t mention something. What’s missing? Go on, I’ll give you a minute. (If you were paying attention, or if you've read about Harper's day elsewhere, you might be able to guess already.)
Player X wasn’t just the first.
Player X is the only.
Of the six players who have walked or walked and been beaned over to first base six times in a game, only Player X did it in a nine-inning game.
Six walks in nine innings. Only been done once.
httpv://youtu.be/hIuIIqbyEIU
Losing Consecutively
The Twins starting the season with a nine-game losing streak was not good. Good teams don't lose a lot of games and even more so don't lose them in long streaks. That got me wondering about how teams with losing streaks fared overall.
It was pointed out here that the Twins streak was more noteworthy because it started the season so it looks even worse. Baseball-Reference only allows searching from the beginning of the season if you want to include all teams over all years so that's the best quick investigations can do. In order to search throughout the season, some work needed to be done.
I processed every season in the modern era through last year and grouped all games together by their streaks. A stretch that went WLLWWW would be a one-game winning streak, a two-game losing streak, and a three-game winning streak. Some brief spot checking of last year's data showed the streaks were properly classified. I merged that with the season results for those seasons in order to associate how teams did given a streak of a certain length.
To start, I decided to look at the range of results for teams with at least a losing streak of every length. The full dataset contains every season since 1900. Here are the number of seasons that contained a losing streak of this length from 1900 through 2015.
| 1 | 2 | 3 | 4 | 5 | 6 | 7 | 8 | 9 | 10 | 11 | 12 | 13 | 14 | 15 | 16 | 17 | 18 | 19 | 20 | 21 | 23 |
|---|---|---|---|---|---|---|---|---|---|---|---|---|---|---|---|---|---|---|---|---|---|
| 2117 | 2116 | 2102 | 1896 | 1469 | 1014 | 605 | 377 | 210 | 130 | 73 | 43 | 27 | 19 | 9 | 2 | 4 | 3 | 4 | 4 | 1 | 1 |
First thing that popped out to me was the 2117 seasons with a one-game losing streak but 2116 seasons with a two-game losing streak. I checked the data to find the season, looked it up and determined it was right. If you want to know which team it is, the answer is at the bottom.
I did not want to have to normalize the seasons to match 162-game seasons nor have to deal with seasons shortened by a strike so I processed only the 162-game seasons. Converting that to a box plot for a pretty picture gives us this.
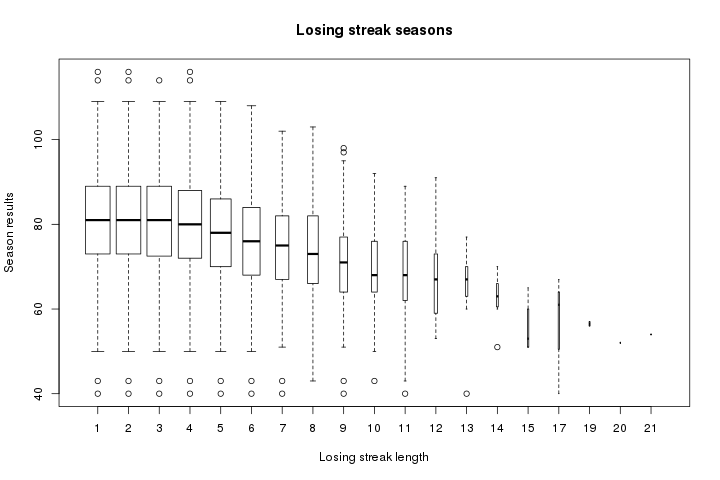
The widths of the box plots represent the number of seasons. The total number of seasons in the data set are 1234. In tabular form it looks like the following.
| Losing streak length | Seasons with that streak | 95th percentile | 75th percentile | Median | 25th percentile | 5th percentile |
|---|---|---|---|---|---|---|
| 1 | 1234 | 109 | 89 | 81.0 | 73.0 | 50 |
| 2 | 1234 | 109 | 89 | 81.0 | 73.0 | 50 |
| 3 | 1232 | 109 | 89 | 81.0 | 72.5 | 50 |
| 4 | 1121 | 109 | 88 | 80.0 | 72.0 | 50 |
| 5 | 882 | 109 | 86 | 78.0 | 70.0 | 50 |
| 6 | 605 | 108 | 84 | 76.0 | 68.0 | 50 |
| 7 | 361 | 102 | 82 | 75.0 | 67.0 | 51 |
| 8 | 229 | 103 | 82 | 73.0 | 66.0 | 43 |
| 9 | 121 | 95 | 77 | 71.0 | 64.0 | 51 |
| 10 | 66 | 92 | 76 | 68.0 | 64.0 | 50 |
| 11 | 37 | 89 | 76 | 68.0 | 62.0 | 43 |
| 12 | 23 | 91 | 73 | 67.0 | 59.0 | 53 |
| 13 | 12 | 77 | 70 | 67.0 | 63.0 | 60 |
| 14 | 7 | 70 | 66 | 63.0 | 60.5 | 60 |
| 15 | 4 | 65 | 60 | 53.0 | 51.0 | 51 |
| 17 | 3 | 67 | 64 | 61.0 | 50.5 | 40 |
| 19 | 2 | 57 | 57 | 56.5 | 56.0 | 56 |
| 20 | 1 | 52 | 52 | 52.0 | 52.0 | 52 |
| 21 | 1 | 54 | 54 | 54.0 | 54.0 | 54 |
Nothing knowing except the Twins having a nine-game losing streak, we would expect them to finish with 71 wins. We do know more than that and the preseason projections were not as kind to project the Twins for 81 wins. Many of them were closer to the high 70s so somewhere between the median and 25th percentile marks seems a more likely scenario.
I did another check on what happens if the losing streak happens in the first quarter of the season but the results are very similar. The sample size also becomes a problem as you get into the longer streaks. So I am skipping that and moving on to postseason probabilities.
It was already known at the beginning of the season that reaching the postseason would be unlikely. Well, losing nine straight hurts that a lot.
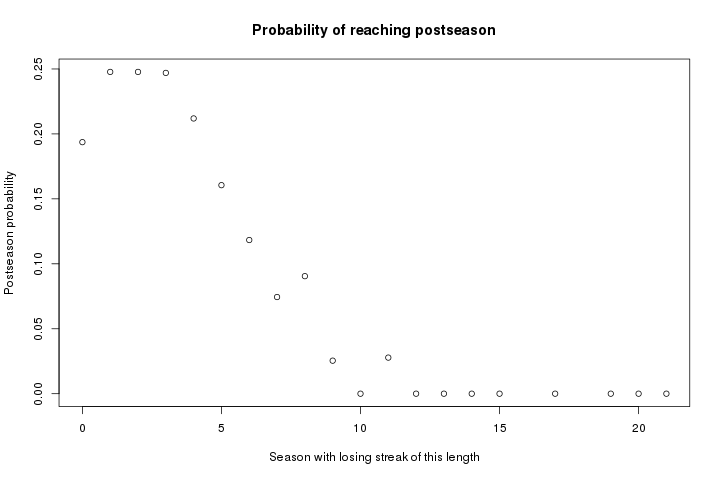
Note the "0" does not mean did not lose at all but instead is a placeholder to mean the average for all seasons.
Good thing they avoided losing ten games instead of nine, unless they managed to stretch it to eleven games. Not much to say here other than don't lose a lot of games if you want to make the postseason.
In conclusion, don't expect good things this year. The team started out with marginal chances for reaching 81 wins and now they're trying to do it in 153 games.
2016 Series 9: Tigers 3, Twins 0
It's getting rather annoying to continue writing "Twins 0" for the series recaps.
The bad:
* Runs prevention. The Tigers averaged 6.3 runs/game.
* Run scoring. The Twins topped out at five runs. Five runs is good but not as a high-water mark. You don't win many games averaging 2.7 runs a game.
* The catchers. Suzuki had a hit and walk on Friday. That was it for both catchers.
The good:
* Duffey. After a short start that wasn't related to performance, Duffey did well enough in his start. Four runs is not good but the peripherals were all fine.
* May. His K/9 did drop over the weekend but it is at 13.8. The walk rate will keep him from being elite but no one can hit his pitches. *Checks his league leading 5 WP* Or know where they're going.
The very good:
* Mauer-Sano-Park. All three raised their OPS over the weekend. That stretch is turning into a solid middle of the order. Mauer leads the team, easily, with 1.1 rWAR. Park is next at 0.6.
2016 SERIES 2 RECAP: ROYALS 3, TWINS 0 (SOSO)
The Twins dropped three straight at the defending champs to fall to 0-6. They will have to win Monday's Home Opener to match 2015's 1-6 horrible start, which they better do because Tuesday would be an awful time for an off day with the team sitting at 0-7.
The Twins not only have not won, they also have not scored more than 3 runs in a game. They haven't done that in 6 games since last June 6-12. That streak also involved 3 games with the Royals, although this time the series was at Target Field.
As for this series:
THE GOOD
Paying Off: Ervin Santana and Ricky Nolasco were both very good. They gave the Twins what the team was hoping for when they signed them to the two largest free agent contracts in franchise history. Santana gave up 2 runs in 6 innings with 7 strikeouts and 2 walks. Nolasco was even better, allowing just 1 run on 3 hits and no walks with 5 strikeouts in 7 innings.
Park Bang: Byung-ho Park hit his first major league home run on Friday. It was a no-doubter in a difficult park to hit it out of, especially with the wind blowing in. It also broke an eighth-inning tie.
Breaking Out: After going 0-for-Baltimore, Brian Dozier broke out in KC by going 4-for-11 with a home run and three walks.
Vaguely Familiar: Joe Mauer is looking like the Joe of old. He went 4-for-9 with 4 walks and an hbp in the series and is batting .400 with 1.069 OPS on the season. What's most exciting is he has improved is K/BB ratio with 4 Ks and 5 BBs. Prior to concussion symptoms ended his catching career, Mauer had more walks than strikeouts. The last two seasons, Mauer has had 127 walks and 208 strikeouts.
THE BAD
Blown Chances: The lack of offense has been the dominant storyline for the Twins, but the Twins still had two late-inning leads in this series and lost both games. Jepsen blew the lead in Game 1 about 3 seconds after Park's first home run landed with an assist on a questionable dive in left field by Eddie Rosario. Perkins blew the save in Game 3 with another assist on another ill-advised dive by Rosario. So despite the lack of offense, the Twins still should have won this series.
Painful Loss: After getting 4 hits in his first start of the season, Eduardo Nunez got hit on his right arm near his wrist and had to be removed from the game before taking the field in the 10th, which left the Twins with no backup infielders.
THE UGLY
Ineffectively Wild: Trevor May has been racking up the strikeouts, but in the 10th inning on Sunday, he walked the leadoff man, bounced a throw to first to send the winning run to third with no outs, and then, after keeping the runner at third with two outs, he then bounced a breaking ball in the dirt in front of home plate for a walkoff wild pitch.
Offensively Bad: There's not much to say that hasn't been said. It's been bad. The good news is that the offense isn't this bad. At least 5 regulars are well below projections and only 2 are above them. All players go through slumps. It doesn't help when a number of players are going through it at the same time. And because it is the start of the season, everything is blown out of proportion. It certainly would help to ease tensions for the batters if the bullpen could have gotten the team a win or two, but you would like to think these players have been around long enough at multiple levels to be able to figure it out soon enough on their own.
2016 MLB Prediction Contest
Put these under a spoiler.
(1 point each)
AL West:
AL Central:
AL East:
AL Wild Card 1:
AL Wild Card 2:
NL West:
NL Central:
NL East:
NL Wild Card 1:
NL Wild Card 2:
(2 points each)
ALDS Winners:
ALCS Winner:
NLDS Winners:
NLCS Winners:
(5 points)
World Series Winner:
(2 points each)
AL MVP:
AL CY:
AL ROY:
AL MOY:
NL MVP:
NL CY:
NL ROY:
NL MOY:
World Series Game 5
I hope this is not the last game of the baseball season.
World Series Game 4
Mets need another win
World Series Game 3
Mets need a win.
Updated one Man’s opinion of top300 Twins-55 years of numbers
Looks like this is year 4 of putting my pet project on the WGOM site, SBG put it on his old site a few years before this. A little movement from last year. Joe still can't quite catch TonyO. Hunter moves up a spot over Jim Perry. Perkins and Dozier jump up in the top60, Plouffe joins the top100, and Sano/Rosario/Hicks/Pelfrey/Milone/Ervin are new to the list with Sano/Rosario/Gibson new to the top200.
I stole most of the idea from when Gleeman started his top40 list years ago (forever unfinished right?) The below quote is his, and the rest is an excerpt from a book I put together 5 years ago. Some of it is outdated, but I’ve updated the list and stats through 2015.
“The rankings only include time spent playing for the Minnesota Twins. In other words, David Ortiz doesn’t get credit for turning into one of the best players in baseball after joining the Red Sox and Paul Molitor doesn’t get credit for being one of the best players in baseball for the Brewers and Blue Jays. The Twins began playing on April 11, 1961, and that’s when these rankings start as well.”
I used a variety of factors, including longevity and peak value. Longevity included how many years the player was a Twin as well as how many plate appearances or innings pitched that player had in those years. For peak value, I looked at their stats, honors, and awards in their best seasons, as well as how they compared to their teammates. Did they lead their team in OPS or home runs or ERA for starters or WPA? If so, that got some bonus points. I factored in postseason heroics, awards (gold gloves, silver sluggers, MVPs, Cy Youngs), statistical achievements (batting titles, home run leaders, ERA champs, etc), and honors (all star appearances), and I looked at team success as well. If you were the #1 starter on a division winning champ, that gave you more points than the #1 starter on a cellar dweller. I looked at some of the advanced stats like WPA, WAR (as calculated by fan graphs and baseball-reference.com), WARP (as calculated by Baseball Prospectus), and Win Shares (as calculated by Bill James). For hitters, I also looked at OPS and the old school triple crown statistics like batting average, home runs, stolen bases, and RBI (and not only where you finished within the AL in any given year, but where you appear on the top25 lists amongst all Twins in the last 50 years). For pitchers I looked at strikeouts, innings pitched, win/loss percentage, ERA as well as ERA+). If there was a metric that was used for all 54 years of Twins history, I tried to incorporate it. I tended to give more credit to guys who were starters instead of part time/platoon players, more credit to position players over pitchers (just slightly, but probably unfairly) and starters over relievers (and closers over middle relievers). There’s no formula to my magic, just looking at a lot of factors and in the end going with the gut in all tie-breakers. Up in the top10 I’m looking at All star appearances, Cy Young and MVP votes, batting average or ERA titles or top10 finishes, etc, and placement in the top25 hitting and pitching lists in Twins history as well. In the middle 100s, it’s more about who started a few more years or had 2 good seasons rather than 1 with possibly an occasional all-star berth or top10 finish in SB or strikeouts. Once you’re in the latter half of the 200s there are none of those on anyone’s resume, so its basically just looking at peak season in OPS+ or ERA+, WAR, Win Shares, and who started the most years, had the most at bats, or pitched the most innings. What the player did as a coach, manager, or broadcaster is not taken into consideration for this list, so Billy Martin, Tom Kelly or Billy Gardner weren’t able to make the top 300 since they were poor players and Frank Quilici didn’t improve his status due to his managing career.
Continue reading Updated one Man’s opinion of top300 Twins-55 years of numbers
